My Musical Journey
Introduction
For over 14 years, Spotify has been my listening platform. This project aims to get into my listening habits, uncovering patterns, preferences, and trends. Let’s analize my extensive Spotify data, and try to understand the evolution of my musical tastes!
The analysis into my listening habits revealed four distinct musical personalities within me. These personalities are encapsulated in four playlists, at the end of the post, each representing a unique sonic identity, generated directly from the data analysis. Get ready!
Data Exploration
To collect my Spotify listening history, I requested the data on this link and combined it with the Spotify API to retrieve genres and features from the songs.
After an initial inspection, the dataset reveales 89,453 songs, comprising 28,463 unique tracks (30% of the total). With a staggering 2,952 hours played (this means 123 days!), I’ve encountered 5,975 distinct artists and 10,078 different albums. Over 14 years, this translates to an average of 17 songs listened to daily - not a bad track record!
Streaming time
My first question centered on the fluctuation of my listening habits over time.
How my listening habits have changed over the years in terms of quantity of music listened? Are there specific events that influenced my music consumption?
The plot illustrates distinct listening patterns, which I’ve attempted to correlate with life events. Periods without a smartphone resulted in significantly fewer plays, while working in a restaurant where I was selecting the music and acquiring a Bluetooth speaker led to increased listening. While there’s still much to uncover, zooming in on specific periods promises deeper insights.
Artists Analysis
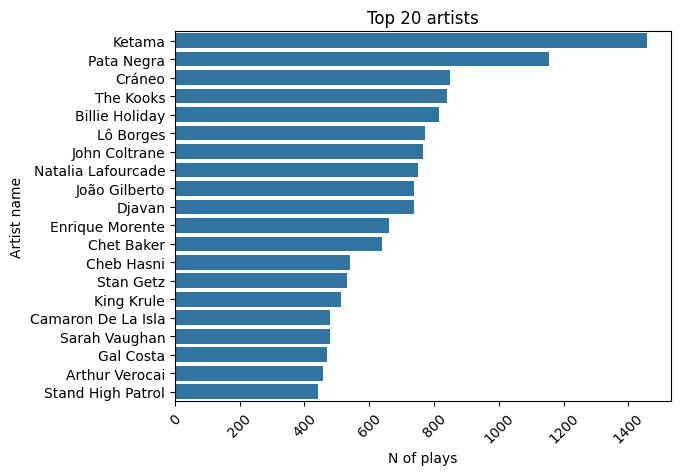
My top artists chart offer a snapshot of my varied musical taste, spanning from the indie rock of my teenage years to the flamenco rhythms of recent times.
To delve deeper, I questioned the depth of my passion for these artists.
Do I consistently listen to the same songs and albums, or do I explore their entire discographies?
Let’s create a bubble chart illustrating the interplay between the number of songs played, unique songs, and unique albums for my top 20 artists.
The plot reveals really different patterns. While it seems I have explored Joao Gilberto’s entire discography, my connection with Pata Negra revolves around a specific set of songs.
Genres
To understand the evolution of my musical tastes, I analyzed genre preferences over time. By categorizing tracks into their primary genres and plotting the distribution over the years, I created a visual representation of my genre journey:
This visualization reveals the three dominant genres of my life: indie rock in my teenage years, jazz in my early twenties, and flamenco in recent years. Is interesting to see how when I get bored of one genre, there are some years with more genre variety, after what one genre escalates.
Interestingly, periods of genre exploration often precede a deep dive into a specific style. Jazz, in particular, has had a profound impact, eclipsing other genres and influencing my taste in MPB, a genre heavily influenced by jazz itself.
And talking about relationship between genres,
How my favourite genres are related between them?
Let’s print out a network connection graph:
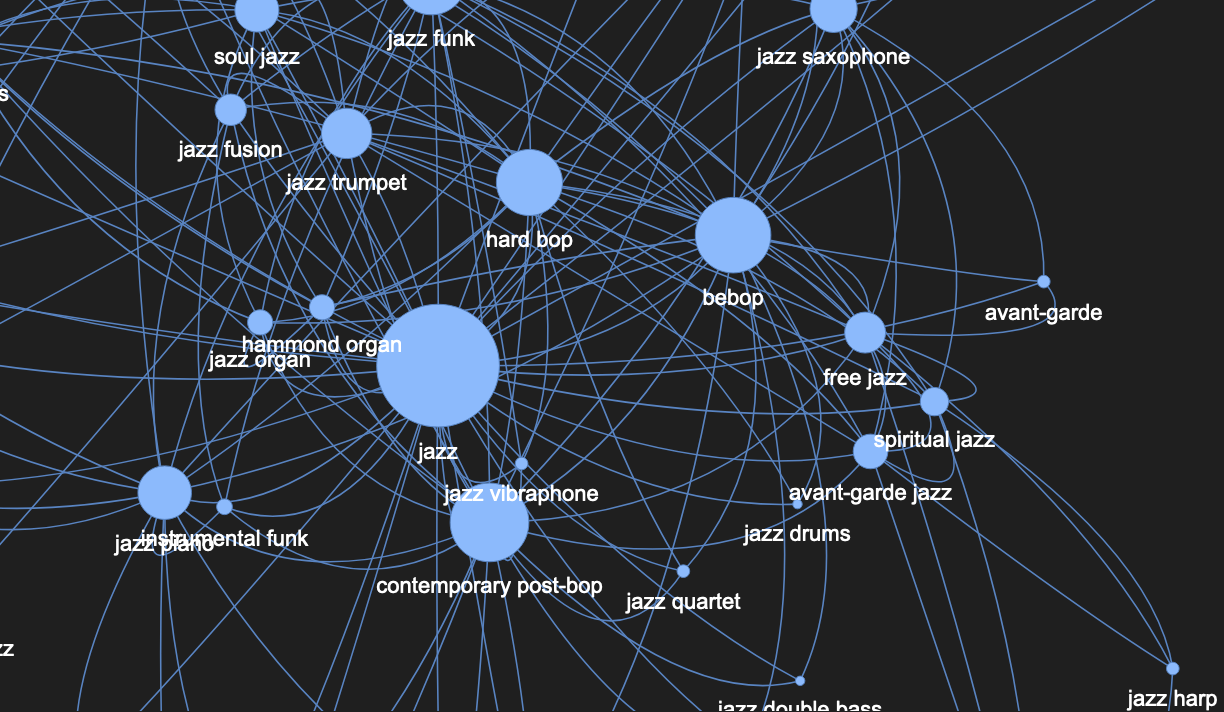
This visualization reveals interesting clusters, some releated between them, as jazz, bossa nova and rock, and some independent entities, as flamenco, hip-hop, reggae or arabic pop. Be sure to click on it to explore the interactive graph (be patient: can take up to a minute to load).
Features
All of this is very interesting, but as a musician, I would love to deep into the sonic characteristics of my music consumption. To do this, I explored a range of audio features provided by Spotify. These features, including energy, danceability, valence, tempo, and acousticness, offer a quantitative lens into the music I enjoy.
Do the moods extracted from my music follow a consistent pattern throughout my life, are they random fluctuations, or are they influenced by life events?
A scatter plot of average energy and tempo over time provides some answers:
The plot suggests distinct mood shifts correlated with significant life events. My university years coincided with a preference for more relaxing music, likely a response to academic stress. Conversely, the end of the COVID-19 quarantine marked a period of renewed energy and freedom.
Besides my general trend, what about the seasonability of the moods? We can ask ourselves,
Are the features influenced by the seasons?
While there’s a general tendency towards decreased danceability during colder months and increased danceability during warmer months, the pattern is not consistently observed.
Classes
As we saw before, we identified distinct clusters based on genre relationships.
Can music features further differentiate these clusters and reveal underlying patterns in mood?
To explore this, we divided the music into groups using the k-means clustering algorithm. Applying the elbow method, we determined that four clusters optimally represent the data. Subsequently, we analyzed the feature representation of these clusters:
(Double click on the legend to isolate each class)
Exploring the plot above, and picking up 10 songs from each class, we can explore what define them and hear how each class sound. Which one is your favourite?
- Class 0: Chill, low energy, melancholic, with acoustic instrumentation.
- Class 1: Energetic, electric instruments, upbeat, and cheerful.
- Class 2: Similar energy to Class 1 but with a focus on acoustic instruments.
- Class 3: Sad and dark, but energetic. Electric instruments.